Faster Call Indexing in Brakeman
Background
About a month ago, an issue was reported where Brakeman taking a ridiculously long time on the “call indexing” step. At the time, I was pessimistic about opportunities to improve the performance of call indexing, since it is a pretty simple operation.
Call Indexing
The majority of the checks performed by Brakeman involve finding and examining method calls (e.g., SQL queries). In order to make these checks faster, Brakeman scans an app once and then saves information about each method call in a data structure called the “call index”. This makes searching for specific method calls very fast.
The call index allows search for methods by name and also by the class of the target. For example, it is possible to search for all calls to open on File. It also allows searching via regular expressions for methods and targets.
Investigation
I happened to notice a Rails application in my collection which also seemed to take a long time indexing calls. So I ran it through perftools.rb to see if there was anything interesting going on.
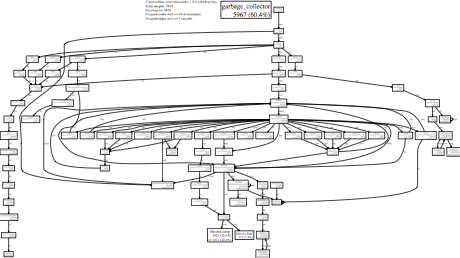
This is the result:
The large amount of time spent in the garbage collector (60%) was high even for Brakeman. But then something else caught my eye:

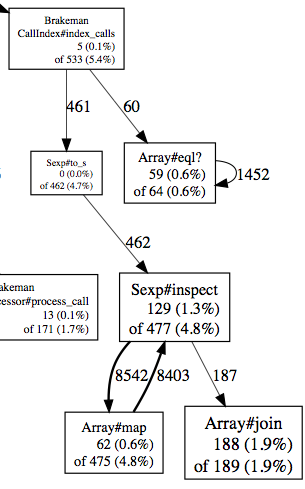
This scan spent 4.7% of its time converting Sexps to strings while indexing calls. This seemed excessive.
This is the entirety of the call indexing code:
```ruby call_index.rb def index_calls calls calls.each do |call| @methods « call[:method].to_s @targets « call[:target].to_s @calls_by_method[call[:method]] « call @calls_by_target[call[:target]] « call end end
`@methods` and `@targets` are sets which contain the string versions of all the methods and method targets. This is *exclusively* used to search for methods and targets via regular expressions.
The call method will always be a symbol...but what about the target? It turns out that while much of the time it is a symbol, if a sane value like `:File` or `:@something` cannot be found, then it will be the entire `Sexp`! This is where Brakeman was wasting time calling `Sexp#to_s`.
The quick fix was to only store symbol targets in the `@targets` set, ignoring any other target values.
## Results
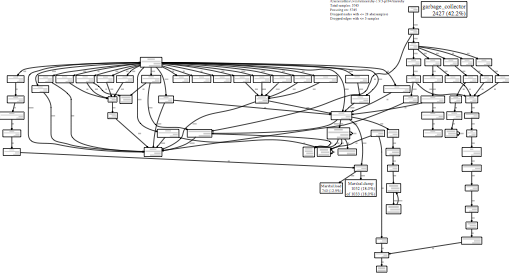
Scanning the same application with Brakeman 1.8.3 has this result:
[](/images/blog/brakeman-scan-1.8.3.pdf)
Garbage collection time dropped from 60% to 42%. While still very high, this is a good sign. Time spent indexing calls has dropped from 5.4% to 1.8% and the calls to `Sexp#to_s` have vanished.
The total scan time dropped from 3.5 minutes to about 2 minutes. For the original reporter, scan times went from [78 minutes to 40 *seconds*](https://github.com/presidentbeef/brakeman/issues/171#issuecomment-10344355).
## More Improvements
Looking through Brakeman, it does not currently use the "search via regex" feature for the call index. So the method and target name sets can be removed entirely.
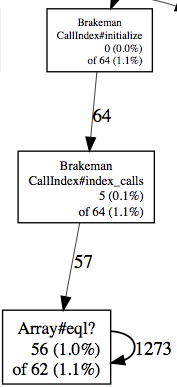
Going even further, nowhere does Brakeman search for targets by any values other than symbols. Note in the graph below that `Array#eql?` was sampled 1,330 times during call indexing:

Since `Sexp`s are subclassed from `Array`, it is clear that these calls are generated when using the `call[:target]` as a hash key (line 6 above). Again, the current Brakeman code only searches for call targets by symbol, never by a full `Sexp`. There is no reason to the call targets that are `Sexp`s.
This is the modified call indexing code:
```ruby Modified call_index.rb
def index_calls calls
calls.each do |call|
@calls_by_method[call[:method]] << call
unless call[:target].is_a? Sexp
@calls_by_target[call[:target]] << call
end
end
end
With this code in place, call indexing does not even show up under perftools. Speed improvements vary by project, but this should at least shave off a few seconds. YMMV.
Wrapping Up
Some quick profiling led me to performance improvements where I really did not expect to find them. Sadly, this is one of the cleanest, simplest parts of Brakeman, so I know there are many other instances where Brakeman can be improved. Prior to the introduction of the call index in Brakeman 1.0, I was trying to keep Brakeman scans under 20 minutes (on large applications). Now I worry when scans take longer than a few minutes.
97% of the open source Rails applications I use as test cases can be scanned in less than 30 seconds. Unfortunately, this probably does not reflect scan times for large, commercial applications. Please report any long-running scans! It may lead to more speed improvements like the ones above.
